OWASP Security Culture
Metrics
Use metrics to measure the progress of the security uplift program. According to OWASP SAMM metrics "evaluate the effectiveness and efficiency of the application security program"1. Metrics help to improve the security maturity by measuring the progress on the defined maturity goals, and allow for adjustments to the security program to ensure the maturity goals are met.
Metrics are used to tell a story to justify an action, such as a security budget, and argue for change2. Metrics are a useful tool to present to management to highlight where there may be gaps in the organisation's security posture that require additional resources to address, or to show that resources spent on security are having the desired effect of reducing risk to the organisation.
To start, examine business processes to see where they can be quantified and measured. Metrics are measured over time, such as quarterly, to show a trend. It is important to know what the desired direction for the metric to move is, up or down, and what activity may have caused significant movement.3
Take note of which Software Development Lifecycle (SDLC) phase has identified the most security issues. It is more expensive to fix security issues later in the development cycle.4 Aim to identify issues sooner in the SDLC in accordance with maturity goals.
Example metrics
Design - Threat Modelling
- number of threat models or threat modelling activities conducted
- number of findings from threat models
Develop - Code Reviews
- number of code reviews conducted
- number of findings from code reviews
Deploy - Security testing
- number of findings from penetration testing (internal vs vendor)
- number of findings from vulnerability scanning
- number of findings remediated
- time taken to remediate a vulnerability, does it meet an SLA (An organisation may require vulnerabilities to be remediated in a certain time frame in accordance with the vulnerabilities risk rating)
Security team collaboration
- number of secure by default modules created
- number of secure architecture designs created and provided to developers
Security champions
- number of security champions onboarded
Training activities
- number of training activities introduced to developers
- number of developers onboarded to training activities
- number of developers engaged in particular training activities
Example graph using metrics
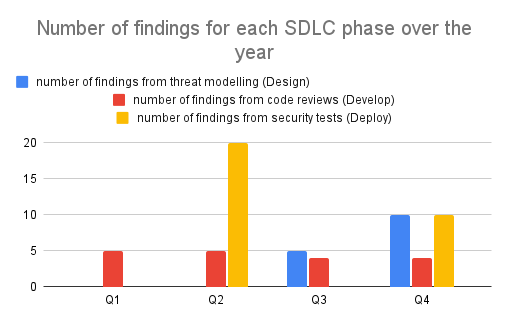
Figure 8-1: Example Metrics Graph
The metric for the number of findings from threat modelling in the Design phase increases in Q3 upon the threat modelling activity implementation for the organisation. This metric increase is expected and desired. The metric further increases in Q4 as the threat modelling activity is scaled out by Security Champions, an expected and desired increase.
The metric for the number of findings from security tests increases in Q2 as a result of a penetration test. This metric increase is expected. Upon a further penetration test in Q4, the metric has decreased from it's earlier record. This metric change is desired, as it represents a cost saving. The cost of addressing security findings increases at later stages of the development lifecycle.
-
OWASP. SAMM. https://owaspsamm.org/model/governance/strategy-and-metrics/stream-b/ ↩
-
Marcus Ranum, AppSec California. 2016. https://www.youtube.com/watch?v=yW7kSVwucSk ↩
-
Ibid. ↩
-
OWASP. Application Security Guide for CISOs. https://owasp.org/www-pdf-archive/Owasp-ciso-guide.pdf ↩